Creating Dynamic Stacked Bar, Doughnut, and Pie Charts using PHP and Chart.js
How to Create Dynamic Stacked Bar, Doughnut and Pie charts in PHP with Chart.js
Chart.js is an open-source JavaScript library that allows developers to create various types of charts and graphs easily. In this blog post, we will explore how to create dynamic stacked bar, doughnut, and pie charts in PHP using Chart.js.
Prerequisites
Before we start, make sure you have the following:
- A basic understanding of PHP and HTML.
- Chart.js library.
- A web server like XAMPP, WAMP, or MAMP.
- A text editor like Visual Studio Code, Sublime Text, or Notepad++.
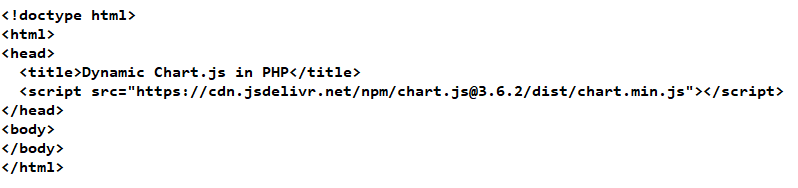
Step 1: Download Chart.js
The first step is to download Chart.js from the official website, or you can use the CDN link to include the Chart.js library.
Initialize Chart.js and load data into dynamic charts
The following JavaScript contains four separate functions. It creates bar, doughnut, pie and stacked-column charts.
Each function requests the PHP endpoint to get the dynamic chart data.It uses the jQuery post method to call the PHP file from JavaScript. In a previous tutorial, we have seen how to use jQuery load method to render HTML dynamicallyThe endpoint URL includes the chart type in its query string. Based on this param the response data will vary.

This script loads the dynamic response data into the chart. The chart legends and labels are also dynamic from the database fetched using PHP.
graph.php
function showBarChart() {
	{
		$.post("ajax-endpoint/get-chart-data.php?chart_type=bar",
			function(data) {
				console.log(data);
				var name = [];
				var marks = [];

				for (var i in data) {
					name.push(data[i].student_name);
					marks.push(data[i].marks);
				}

				var chartdata = {
					labels: name,
					datasets: [
						{
							label: 'Student Marks',
							backgroundColor: '#49e2ff',
							borderColor: '#46d5f1',
							hoverBackgroundColor: '#CCCCCC',
							hoverBorderColor: '#666666',
							data: marks
						}
					]
				};

				var graphTarget = $("#bar-chart");

				var graph = new Chart(graphTarget, {
					type: 'bar',
					data: chartdata
				});
			});
	}
}

function showPieChart() {
	{
		$.post("ajax-endpoint/get-chart-data.php?chart_type=pie",
			function(data) {
				var name = [];
				var marks = [];
				var bgColor = [];

				for (var i in data) {
					name.push(data[i].label);
					marks.push(data[i].data);
					bgColor.push(data[i].backgroundColor);
				}

				var chartdata = {
					labels: name,
					datasets: [
						{
							label: 'Student Marks',
							backgroundColor: bgColor,
							data: marks
						}
					]
				};

				var graphTarget = $("#pie-chart");

				var graph = new Chart(graphTarget, {
					type: 'pie',
					data: chartdata
				});
			});
	}
}

function showDoughnutChart() {
	{
		Chart.pluginService.register({
			beforeDraw: function(chart) {
				var width = chart.chart.width,
					height = chart.chart.height + 35,
					ctx = chart.chart.ctx;

				ctx.save();
				ctx.font = "bold 1.5em sans-serif";
				ctx.textBaseline = "middle";


				var text = "100",
					textX = Math.round((width - ctx.measureText(text).width) / 2),
					textY = height / 2;
				ctx.fillStyle = 'rgba(0, 0, 0, 1)';
				ctx.fillText(text, textX, textY);
				ctx.restore();
			}
		});

		$.post("ajax-endpoint/get-chart-data.php?chart_type=doughnut",
			function(data) {
				var name = [];
				var marks = [];
				var bgColor = [];

				for (var i in data) {
					name.push(data[i].label);
					marks.push(data[i].data);
					bgColor.push(data[i].backgroundColor);
				}

				var chartdata = {
					labels: name,
					datasets: [
						{
							label: 'Student Marks',
							backgroundColor: bgColor,
							data: marks
						}
					]
				};

				var graphTarget = $("#doughnut-chart");

				var graph = new Chart(graphTarget, {
					type: 'doughnut',
					data: chartdata,
					options: {
					}
				});
			});
	}
}


function showStackedVerticalChart() {
	{
		$.post("ajax-endpoint/get-chart-data.php?chart_type=vertical-bar",
			function(data) {
				var chartdata = {
					labels: ['Marks'],
					datasets: data
				};

				var graphTarget = $("#stacked-vertical-chart");

				var graph = new Chart(graphTarget, {
					type: 'bar',
					data: chartdata,
					options: {
						scales: {
					        xAxes: [{
					        	barPercentage: 0.3,
            					stacked: true
					        }],
					        yAxes: [{
					        	stacked: true
					        }]
					    }
					}
				});
			});
	}
}
Create PHP Model, Utils to prepare chart data
When we create a chart in PHP with dynamic data, it depends on the model or service handers on the server-side.
The model prepares the dynamic data format from an external source like files or a database.
In this model, the handlers read the chart data from the database. The chart.tbl_marks table maps the student identity data with the marks one-to-one.
Student.php
namespace Phppot;

class Student
{

    private $dbConn;

    public function __construct()
    {
        require_once __DIR__ . '/DataSource.php';
        $this->dbConn = new DataSource();
    }

    function getStudentMark()
    {
        $query = "SELECT student_id,student_name,marks FROM tbl_marks ORDER BY student_id";
        $result = $this->dbConn->select($query);
        return $result;
    }
}
And, it has the utils class to dynamically supply the background color to the chart.The Util class generates the random color code to the chart slices and the stacked bars.When we see how to create charts using Google Charts, it has a fixed array of colors supplied to the chart slices.The Google Charts services also provide very good results for showing statistical graphs.
Util.php
namespace Phppot;

class Util
{

    function getRGBRandom()
    {
        $rgbRandom = str_pad(dechex(mt_rand(0, 255)), 2, '0', STR_PAD_LEFT);
        return $rgbRandom;
    }

    function getRandomColor()
    {
        $randomColor = "#";
        for ($i = 0; $i < 3; $i ++) {
            $randomColor .= $this->getRGBRandom();
        }
        return $randomColor;
    }
}
Database script
This database script shows the statements to create the table structure. It also has the sample data to load into the chart initialization process. Download the code and import the script to run this chart example.In a previous article, we have created a database to keep attendance data. Thereby, it created charts using Google charts.
-- Table structure for table `tbl_marks`
--

CREATE TABLE `tbl_marks` (
  `student_id` int(10) UNSIGNED NOT NULL,
  `student_name` varchar(35) NOT NULL,
  `marks` int(11) DEFAULT 0
) ENGINE=InnoDB DEFAULT CHARSET=utf8;

--
-- Dumping data for table `tbl_marks`
--

INSERT INTO `tbl_marks` (`student_id`, `student_name`, `marks`) VALUES
(1, 'Matthew', 39),
(2, 'Hannah', 46),
(3, 'Merlin', 65),
(4, 'Jelin', 90),
(5, 'Hilda', 75);

--
-- Indexes for dumped tables
--

--
-- Indexes for table `tbl_marks`
--
ALTER TABLE `tbl_marks`
  ADD PRIMARY KEY (`student_id`);
Conclusion
This article described how to create a chart in PHP with JavaScript library Chart.js. The example code has structured dynamic blocks and the backend logic.We have displayed the marks statistics in the form of a pie chart, doughnut chart and stacked bar chart. In the doughnut chart, it displays the text to state the mark out of which the student marks are shown.The separate graph initializations script made the chart rendering process easier. It contains code to supply JSON response into the JavaScript to plot the metrics into the chart UI.With dynamic data loading, it is possible to make use of this code in a real-time application easily.